One App Designed
To Help You Win
Welcome @thlete V2.0.
Stand on top of your data.
Platform core, plug-in modules, and an athlete app—built to scale with your team.
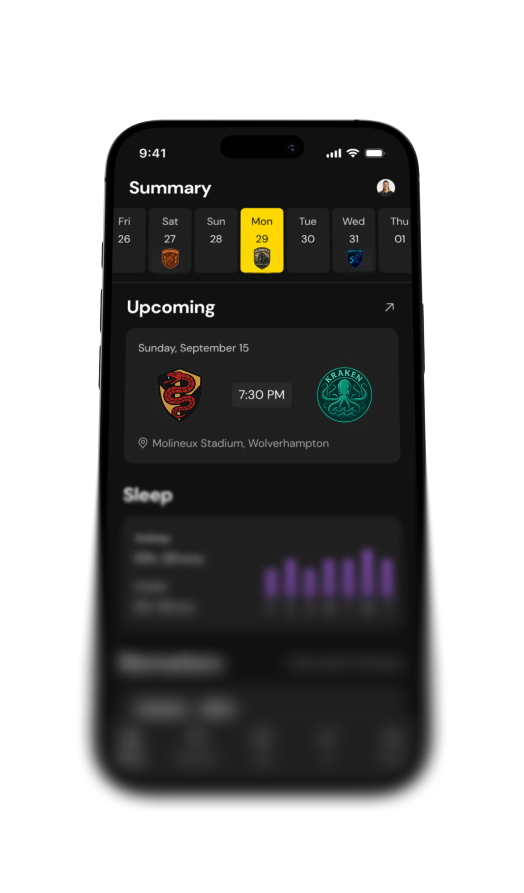
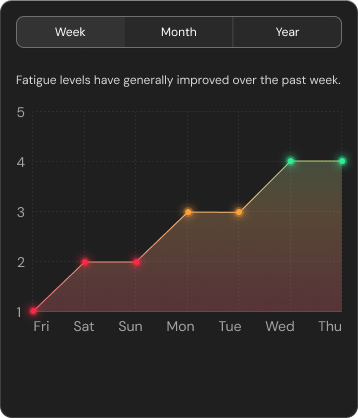
At a glance.
Keep yourself informed on key metrics, like sleep, mood, and soreness.
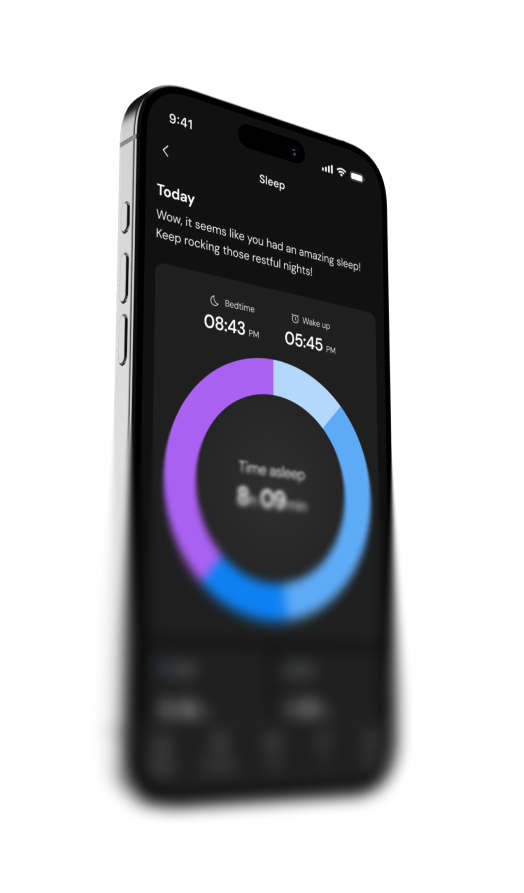
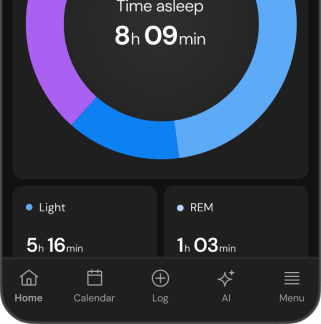
Optimize recovery.
Keep yourself informed on key metrics, like sleep, mood, and soreness.
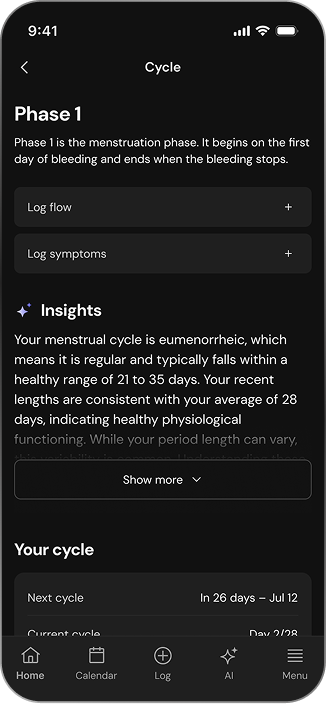
Understand your body.
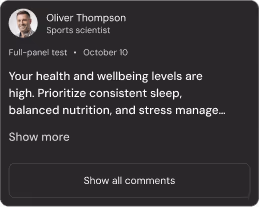
Personal guidance for recovery, readiness and wellness—giving athletes ownership of their data.
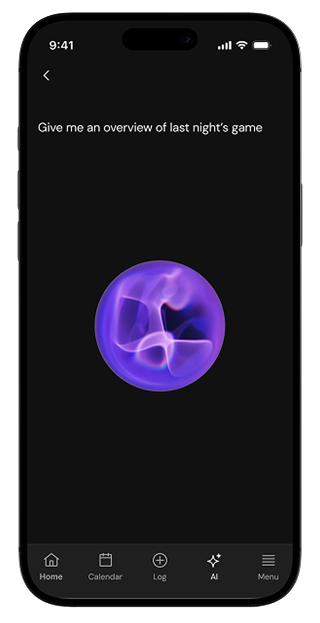
Speak directly to your data.
Your performance data, now conversational. Ask questions, explore trends, and get insights shaped by sport science expertise.
Everything for you to always be on top of your game.
Smarter tracking. Stronger results.

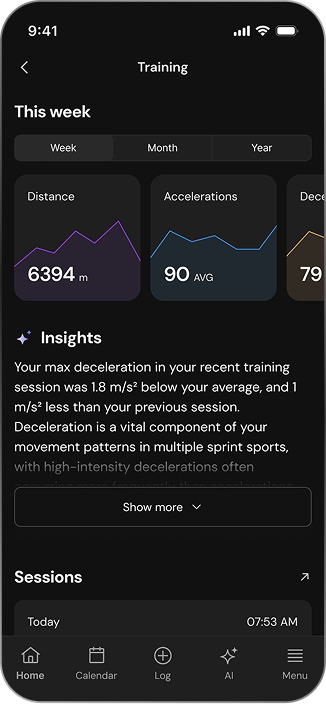
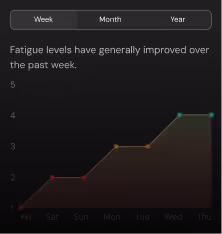
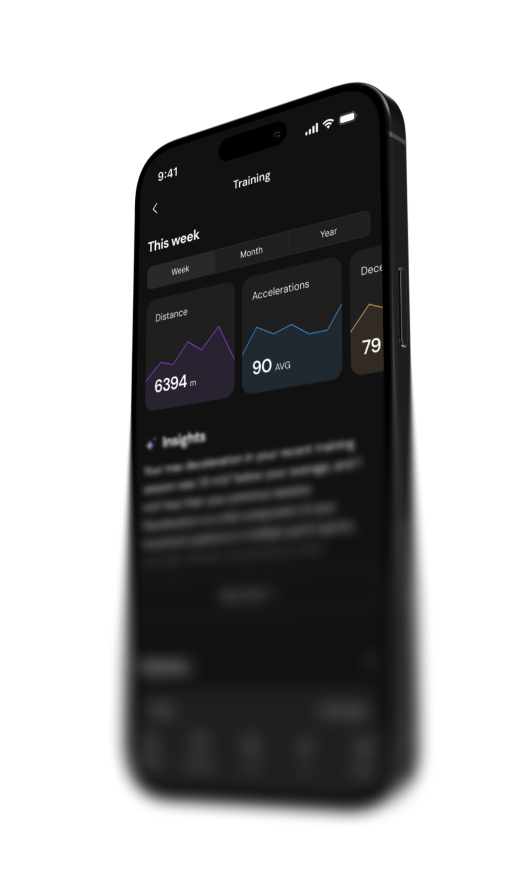
Train smarter, Grow stronger
Analyze your training, identify meaningful trends, and uncover insights that inform better decision-making.
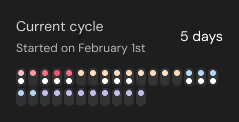
Holistic health for female athletes
Gain tailored, evidence-based insights built specifically for female athletes.


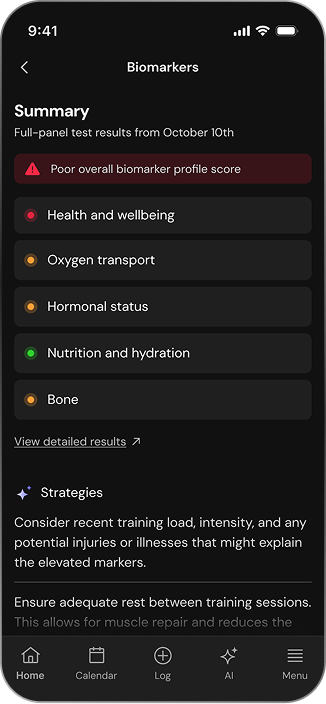
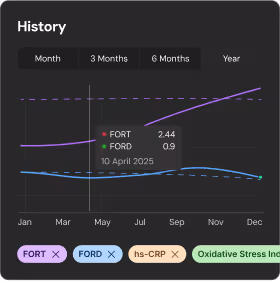
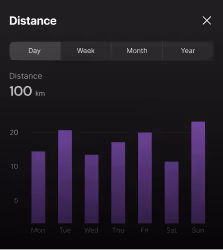
Unlock your body's true potential
Monitor your biomarkers over time and learn how each marker influences performance. Grounded in objective data, see the real physiological effects of load, stress, and recovery.
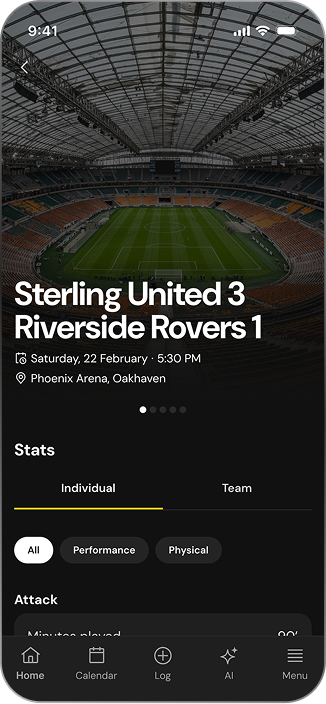
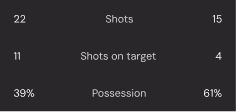
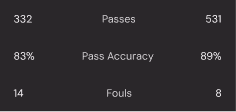
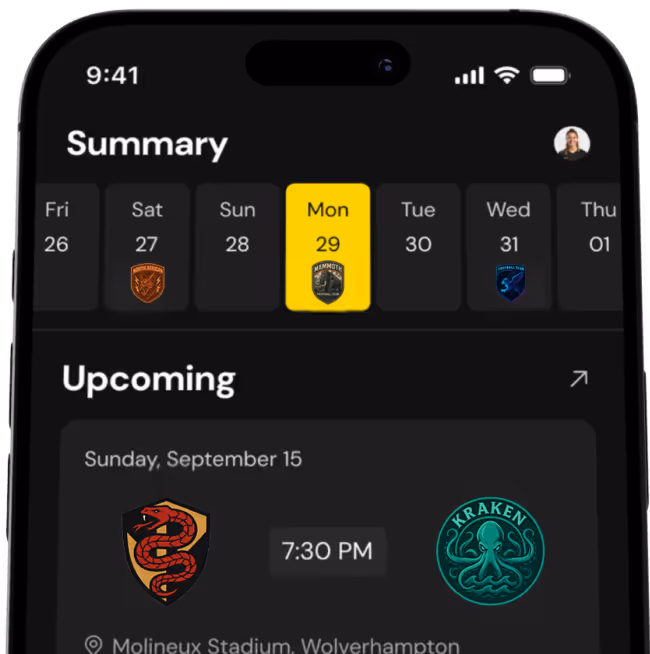
Dominate every match
Analyze your match performances in detail - track performance stats, compare yourself to teammates and opponents, and receive tailored recommendations for your next game. Identify key matchups and step onto the field fully prepared.